
World Happiness Visualization
A Python Flask app representing world happiness from 2015-2017 using D3.js - Plotly.js and AnyChart.js to create visualization.
Visualization 2
Data Reduction using random sampling and Stratified sampling using k means clustering. Dimension reduction using PCA. PCA, MDS,ISOMap Implementation of...
lost in recommendations
Lost in Recommendations is a Flask based WebApp that uses D3.js force directed graphs to visualize YouTube/Wikipedia recommendations.
Data jobs analysis
Analyzing Data related Jobs & Freelance Market to help other data nerds on thier journey wish you will like it🤓.
dimension_reduction_text_data
This project uses the dimension reduction method to handle text data and visualizes it with d3.js.
GitHubScore
This is a web app that allows users to enter their Github username to display metrics about their number of...
BellyButtonBiodiversity
An interactive dashboard for exploring the various bacteria present on the human belly button. Created with Python (Flask), SQLAlchemy ORM,...
StockData
StonkTA creates a community where traders can easily analyze charts and connect and communicate with other traders.
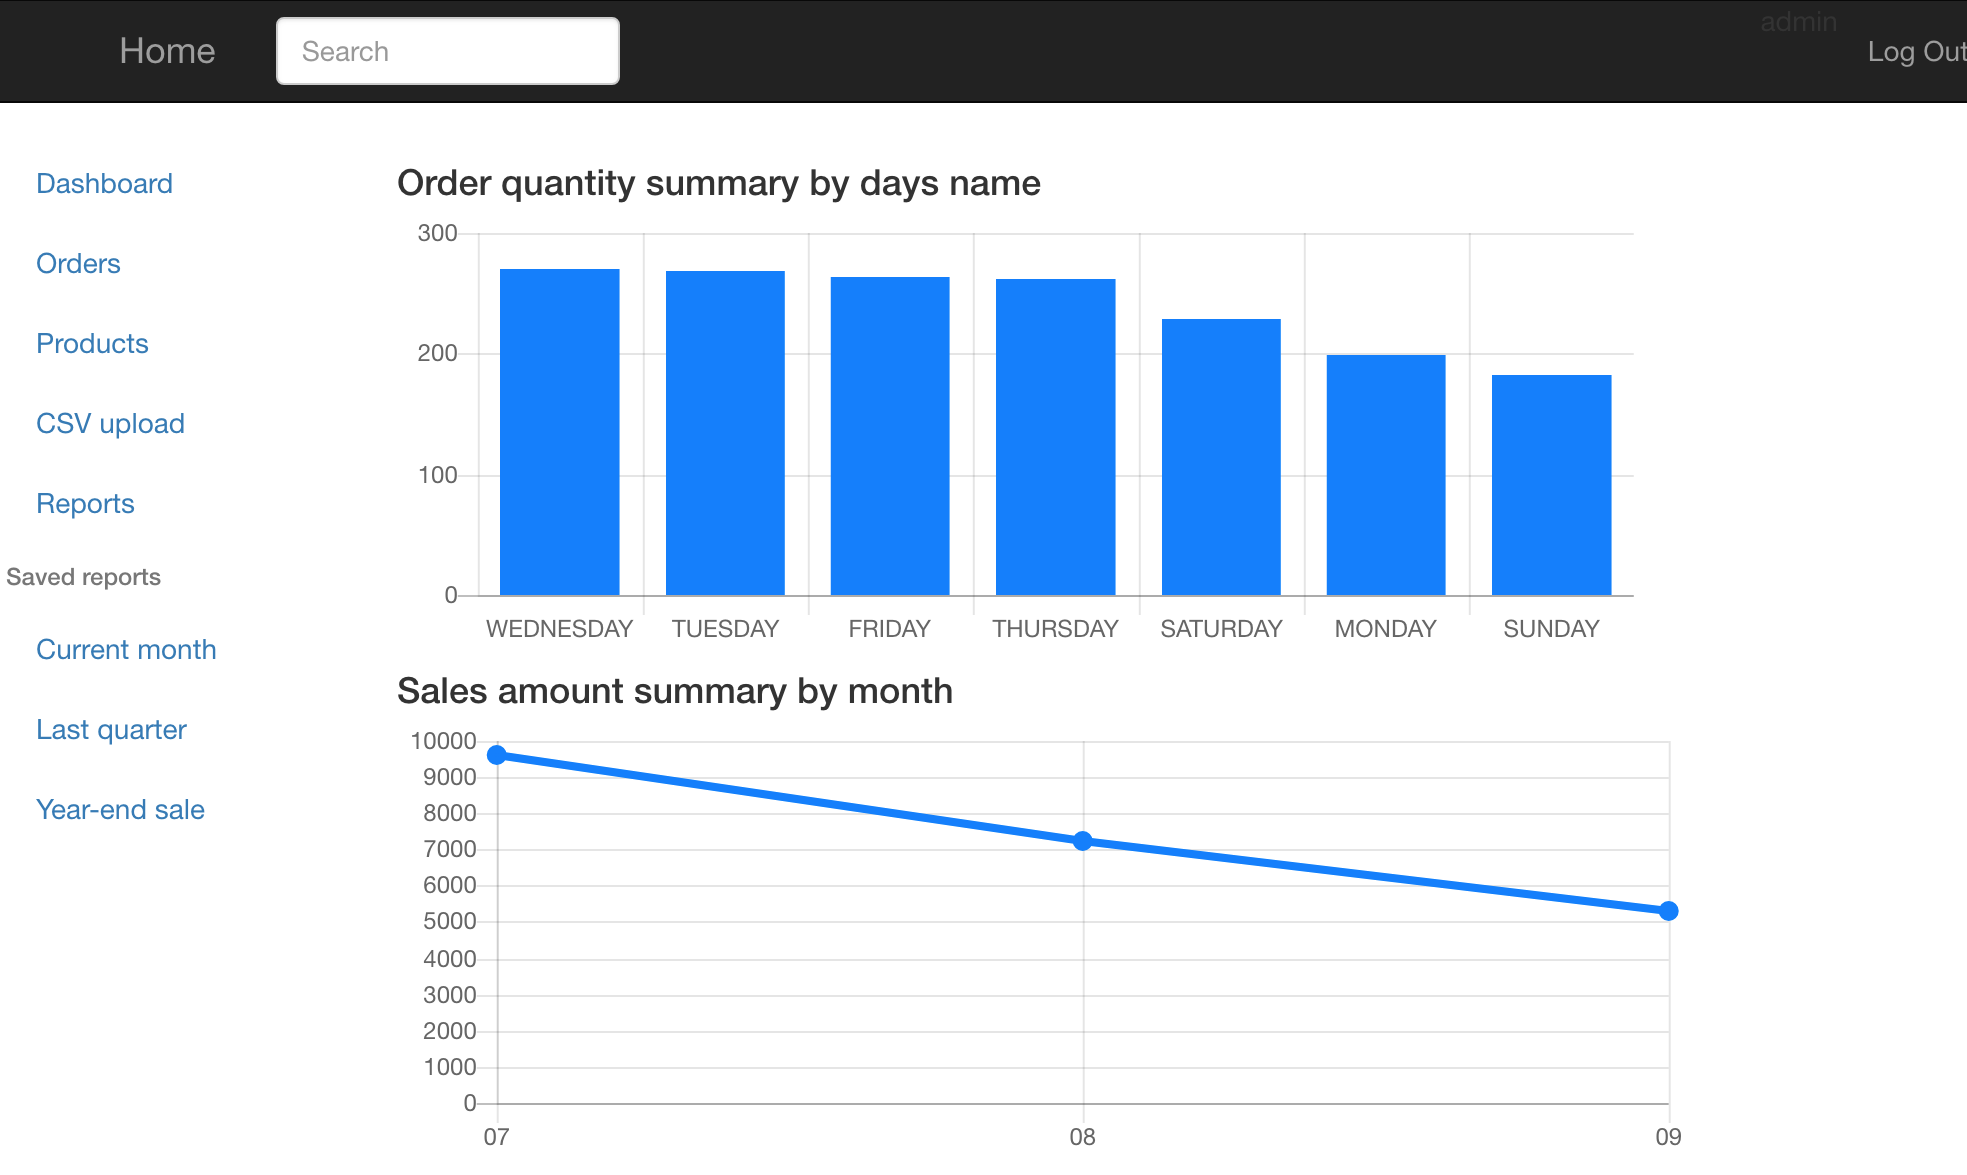
DonorsChoose
A D3.js and Flask powered data analytics dashboard for visualising donations to DonorsChoose Organisation

demo grapher
DemoGrapher is a web application that helps in efficiently visualizing students data segregated by demographics. The information can be refined...