by Anju Chamantha(170074T)
Website : http://e-monitor.herokuapp.com
GitHub : https://github.com/anjuchamantha/EMonitor
YouTube : https://youtu.be/ITUB2IDSrXQ
[TOC]
EMonitor is a ESP32 Microcontroller based device which gets environmental data such as Temperature, Humidity, Pressure, Light Intensity, and sends those data to a Back-end database server using CAP(Common Alert Protocol). Also those data and other connection status information can be viewed from the OLED-display locally. The data that were sent to the server can be visualized using a simple web-page. The device also features self fault recovery mechanisms to add more reliability to the system. EMonitor also sends a warning e-mail to pre-defined e-mail addresses in case of any sensor data exceeds a given threshold value.
Prototype Device


Scope of the Project
EMonitor is a ESP32 microcontroller based device which has Wi-Fi inbuilt. With its Xtensa LX6 microprocessor operating at 240 MHz and memory of 520 KiB SRAM, EMonitor is more than capable of capturing the environment and sending data to the server after doing the necessary calculations seamlessly. It runs on FreeRTOS, a leading operating system supported by Arduino which can be working with the relevant peripherals smoothly.
- Temperature (°C) - DHT11 Sensor module
- Humidity (%) - DHT11 Sensor module
- Pressure (Pa) - BMP180 Sensor module
- Light Level (%) - LDR module
The device can be powered using a Micro USB cable which is a very reliable mode of powering the ESP32 microcontroller. Since almost every standard mobile phone charging adapter outputs 5V, this device can be powered using the same way which means there's nothing to worry about power. Also EMonitor can be powered using any mobile phone charging power-bank which makes the device portable.
The ESP32 is a low power consuming microcontroller relative to other microcontrollers in the market, and has adaptive power controlling mechanisms which can handle some basic power related matters that makes the EMonitor very reliable when powering with Micro USB cable.
Data is transmitted from the EMonitor device to the cloud hosted EMonitor server using CAP (Common Alerting Protocol) over internet. CAP is an XML based data format for exchanging public warnings and emergencies between alerting technologies.
The sensor data (temperature, humidity, pressure, light level) are read at T time intervals and after N number of sensor readings, the Mean & Standard Deviation of those N number of data are sent to the server using CAP protocol. So the data is sent to the server at TN time intervals. (There can be an average 2-3s delay other than TN due to the other logics and calculations)
Example : Take N=15 & T=60s => The sensor readings are taken every 1 minute and after 15 rounds/readings (after 1min x 15 = 15 minutes) the mean and standard deviation of those 15 samples are sent to the server.
Following are the basic data sent to the server as a message which is referred as MSG hereafter.
msg_id, timestamp, temperature, humidity, pressure, light, temperature_sd, humidity_sd, pressure_sd, light_sd
Other than these data, some constant data that are mandatory for CAP, like sender,msg type, category, urgency etc are also sent to the server.
The EMonitor device is capable of withstanding the following scenarios in which the connection is lost.
- Wi-Fi connection Lost
- Loss of connection to the EMonitor server
The device can self re-connect to Wi-Fi or self re-connect to server in any of the above cases. But the data is secure even during such connection issues.
In both above cases EMonitor detects the connection issue and cash the raw data which were not sent to the server due to connection loss, to a buffer. After each TN time interval, the device checks the connection and if the connection is stable, it sends all the data which were buffered, to the server and clears the buffer. (During this process also if the connection is lost, it keeps the data safe in the buffer without removing)
Deployed EMonitor website : http://e-monitor.herokuapp.com/

The backend server is developed using Flask which is a Python based web framework. It supports all the existing python libraries and tools and hence it is very much scalable and extensible.
The database used is PostgreSQL and all the data that comes to the server from the EMonitor device are saved in a database table of values, msg_id, timestamp, temperature, humidity, pressure, light, temperature_sd, humidity_sd, pressure_sd, light_sd
Backend supports the following end-points to communicate with it.
- [POST] : /data
- [GET] : /
The EMonitor device uses /data end-point to send data to the server using CAP protocol.
/ endpoint is used to access the main dashboard of the EMonitor website, which shows the current(last received) readings as well as charts and the data of last 20 readings received.
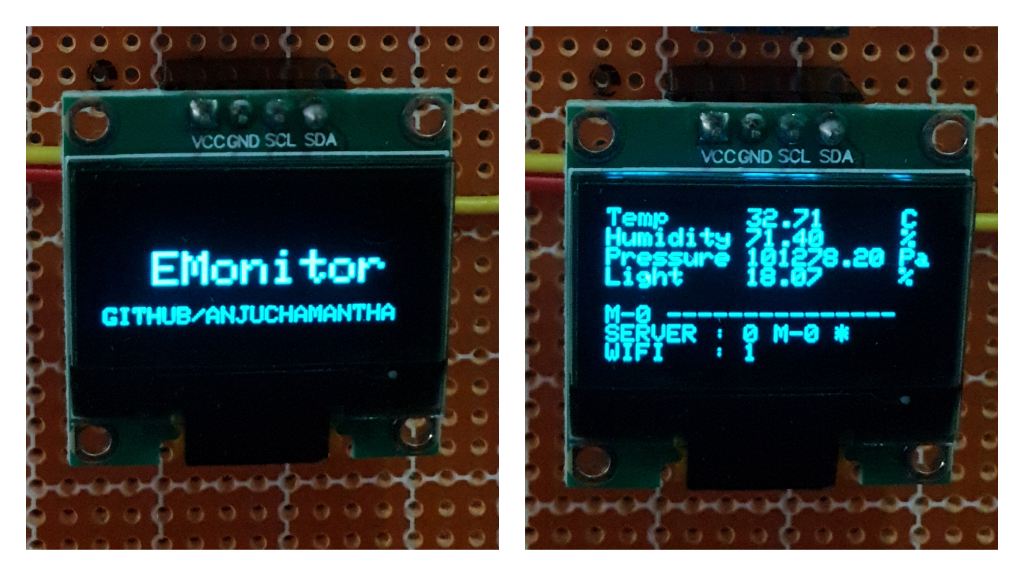
OLED Display shows the temperature, humidity, pressure and light level values which are sent to the server with the msg_id after each TN time interval. Also it shows the Wi-Fi and Server connection statuses.(0 - Not connected, 1 - Connected)
It also shows if a MSG is not sent to the server and buffered (using a * symbol) and sends buffered MSGs to the server (using <B> symbol)

The EMonitor device sends a WARNING e-mail to a pre defined e-mail address if a value of a MSG exceeds a given threshold limit.
Currently if the temperature mean exceeds 40°C it sends a warning e-mail to my personal email.

Breadboard Circuit Schematic
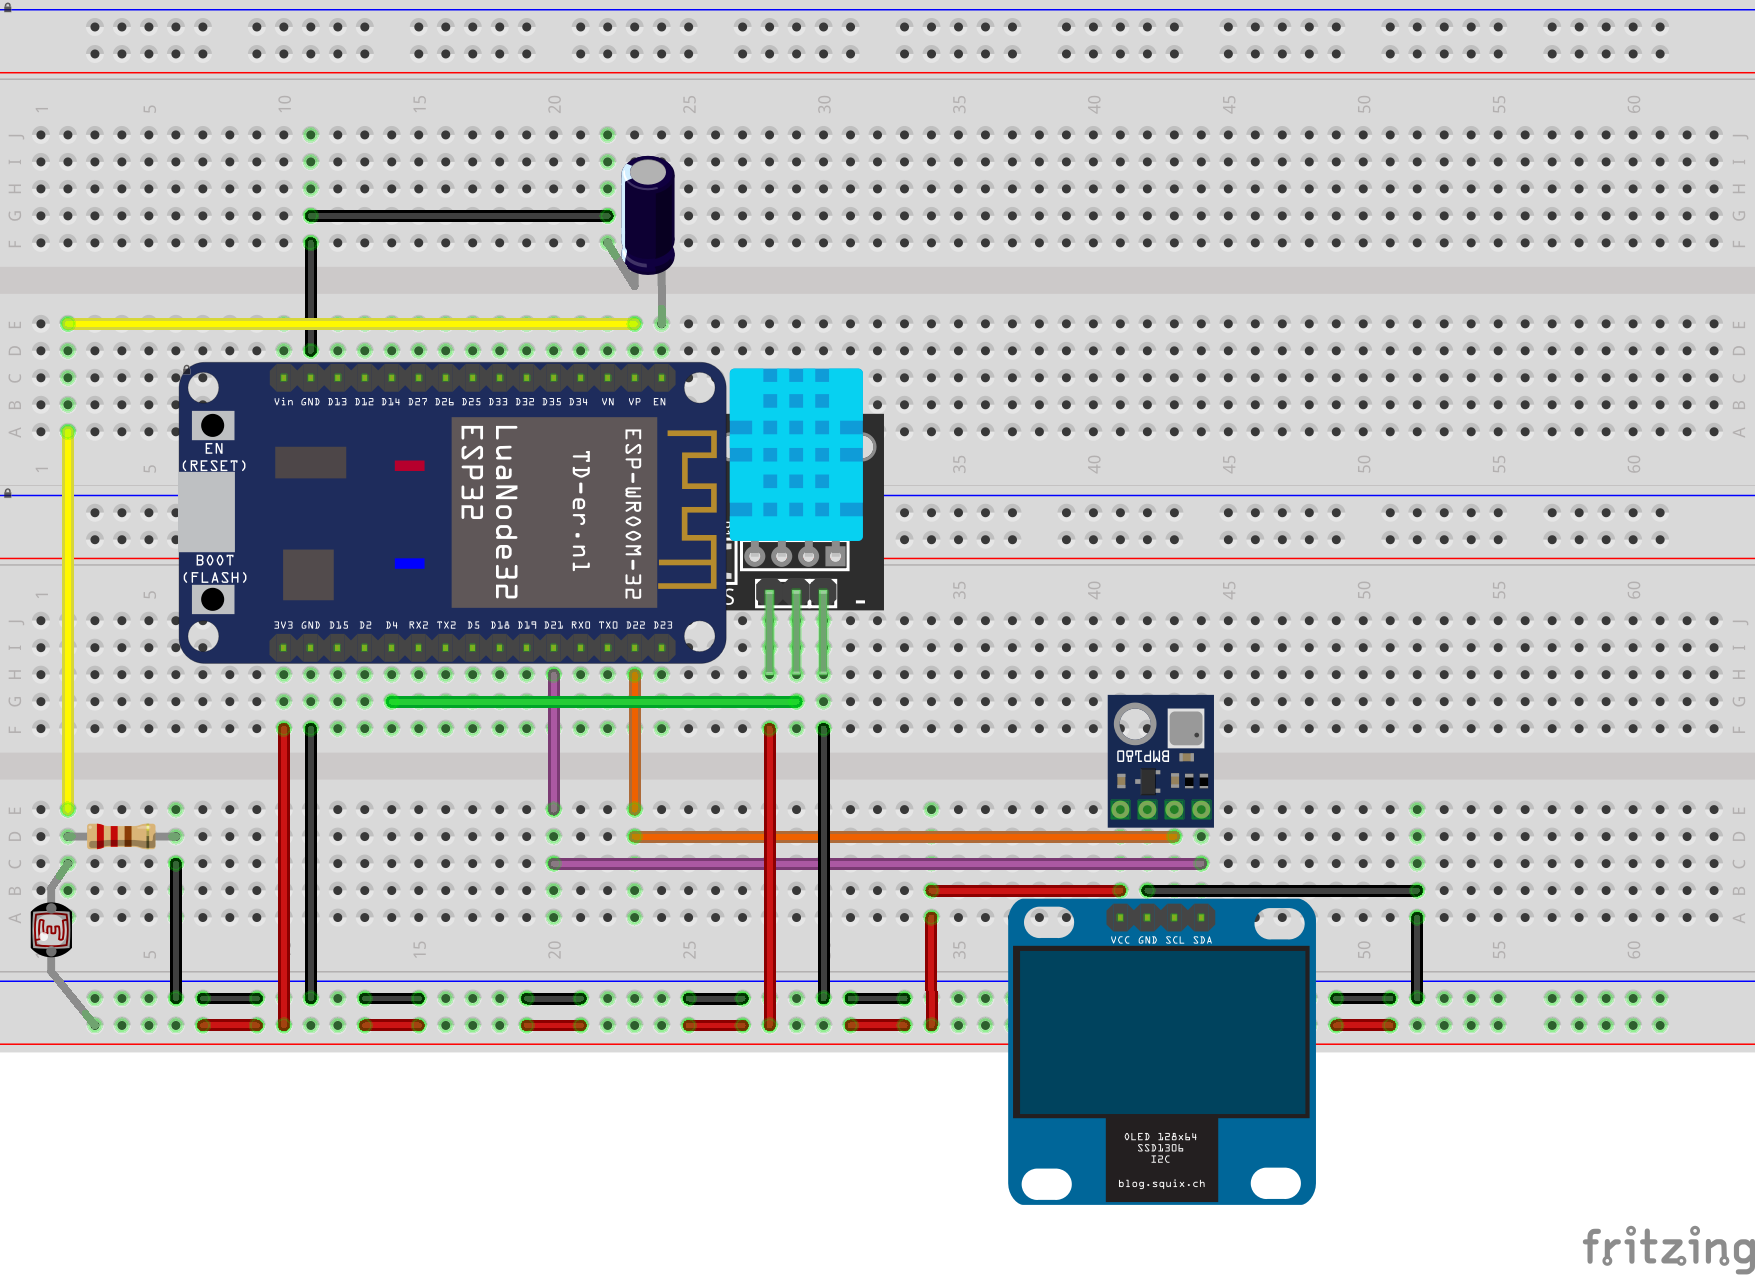
Schematic Diagram

PCB Design

As mentioned in 2.5) Self-Recovery in a Connection Loss, EMonitor is capable of self connecting to Wi-Fi & Server after a connection retrieval. During the period of connection loss, the MSGs are buffered and when the connection is established back, it sends the buffered MSGs to the server.
void loop{
	//calculate readings and create CAP MSG
    if (WiFi.status() != WL_CONNECTED)
    {
        //if not connected, try to connect to WiFi in each loop iteration
        bool connected = connect_to_wifi();
        if (connected){
            //send MSG to server
        }
        else{
            //buffer MSG
        }
    }
    else{
        //send MSG to server
    }
}

bool connect_to_wifi(){
    WiFi.begin(SSID,PW) //begin the wifi connection
    if (WiFi.status() == WL_CONNECTED)
    {
        return truue;
    }
    else{
        return false;
    }
}There are total of 11 buffers as follows
queue<String> buffer_identifier;
queue<String> buffer_datetime;
queue<int> buffer_msg_ids;

//mean buffers
queue<double> buffer_t;
queue<double> buffer_h;
queue<double> buffer_p;
queue<double> buffer_l;

//sd buffers
queue<double> buffer_t_;
queue<double> buffer_h_;
queue<double> buffer_p_;
queue<double> buffer_l_;
void loop{
//BUFFER LOGIC
//loop buffer if buffer is not empty
// if connected
// POST buffer data and pop from buffer
// else break
while (!buffer_msg_ids.empty()){
if (WiFi.status() == WL_CONNECTED){
//create CAP MSG from raw data in buffers
if (sendPostRequest(xmlchar_buf, msg_id_buf)){
popBuffers();
}
}
}
//MAIN LOGIC
//calculate readings and create CAP MSG
if (WiFi.status() != WL_CONNECTED)
{
bool connected = connect_to_wifi();
if (connected){
//send MSG to server
if (!sendPostRequest(xmlchar, msg)){
//buffer MSG
pushToBuffers();
}
}
else{
//buffer MSG
pushToBuffers();
}
}
else{
//send MSG to server
if (!sendPostRequest(xmlchar, msg)){
//buffer MSG
pushToBuffers();
}
}
}
void pushToBuffers(){
//push all the raw data needed for MSG to queues
}
void popBuffers(){
//pop the front element from the queues
}
When after a power failure and when the power is retrieved back, the device is automatically started and continued the data reading and data transmitting process as usual.
- NodeMCU ESP-32S Microcontroller (LKR 1,050.00)
- BMP180 Digital Barometric Pressure Sensor (LKR 185.00)
- DHT11 Temperature & Relative Humidity Sensor (LKR 250.00)
- LDR (LKR 10)
- OLED Display 0.96" (LKR 600.00)
- Resistor 220Ohm (LKR 1.00)
- Capacitor 10 micro F (LKR 20) - Used to back out the code uploading issue of ESP32
- Vero Board & Circuit Wires (LKR 150)
main.cpp
void beginOLED(){
    //initial setup and starting of OLED Display
}
void displayText(){
    //display the content in the OLED display
    //in various places, this function is called to print sensor and other information
}
void getTimeStamp(){
    //get the current time
}
void popBuffers(){
    //pop the front element from the queues
}
void pushToBuffers(){
    //push all the raw data needed for MSG to queues
}

void setup(){
    beginOLED();
    wait_and_connect_to_wifi();
  	begin_sensors();
    configTime();
}

void loop(){

  //BUFFER LOGIC

  //loop buffer if buffer is not empty
  //	if connected
  //		POST buffer data and pop from buffer
  //	else break
    while (!buffer_msg_ids.empty()){
        if (WiFi.status() == WL_CONNECTED){
            //generate CAP XML message from the data in buffers
            generateXMLStr();
            if (sendPostRequest(xmlchar_buf, msg_id_buf)){
                popBuffers();
            }
        }
    }

    //MAIN LOGIC

	//calculate readings and create CAP MSG
    int x = 0;
    int rounds = 15;
  	int round_time = 2000;
    while (x < rounds){
        readTemperature();
        readHumidity();
        readPressure();
        readLightIntensity();

        delay(round_time);
        x++;
    }
    temperature = calculate_mean(t_, rounds);
  	humidity = calculate_mean(h_, rounds);
  	pressure = calculate_mean(p_, rounds);
  	light = calculate_mean(l_, rounds);

    temperature_sd = calculate_sd(t_, rounds, temperature);
  	humidity_sd = calculate_sd(h_, rounds, humidity);
  	pressure_sd = calculate_sd(p_, rounds, pressure);
  	light_sd = calculate_sd(l_, rounds, light);

    getTimeStamp(datetime_);

    //send WARNING e-mail
    if ((temperature > 40) && (WiFi.status() == WL_CONNECTED)){
        //if a warning e-mail has not sent in last 5minutes
        //	send mail
    }

    //generate CAP XML message from the calculated data
    generateXMLStr();

    if (WiFi.status() != WL_CONNECTED)
    {
        bool connected = connect_to_wifi();
        if (connected){
            //send MSG to server
            if (!sendPostRequest(xmlchar, msg)){
                //buffer MSG
                pushToBuffers();
            }
        }
        else{
            //buffer MSG
            pushToBuffers();
        }
    }
    else{
        //send MSG to server
        if (!sendPostRequest(xmlchar, msg)){
            //buffer MSG
            pushToBuffers();
        }
    }
}
#database table model
class EMonitor(db.Model):
    __tablename__ = 'sensor_data'
    id = db.Column(db.Integer, primary_key=True)
    msg_id = db.Column(db.String(128))
    timestamp = db.Column(db.String(128))

    temperature = db.Column(db.Float)
    humidity = db.Column(db.Float)
    pressure = db.Column(db.Float)
    light = db.Column(db.Float)

    temperature_sd = db.Column(db.Float)
    humidity_sd = db.Column(db.Float)
    pressure_sd = db.Column(db.Float)
    light_sd = db.Column(db.Float)


def extract_data_from_xml(xml_str):
    """
    Given a XML string(CAP) this extracts the 'parameter' values
    :param xml_str: XML as a string
    :return: data as dictionary {name:value}
    """

def put_to_db(xml_data):
    """
    given a data dictionary this method put the data to the database
    :param xml_data: data as dictionary {name:value}
    :return: True if database write successful, otherwise False
    """

@app.route('/data', methods=['POST'])
def post():
    xml_str = request.data
    xml_data = extract_data_from_xml(xml_str)
    print("[POST] /data : ", xml_data)
    if put_to_db(xml_data):
        return "DATABASE updated"
    else:
        return "DATABASE modification failed !"

@app.route('/')
def index():
    #query the database table and get the list of data
    table = EMonitor.query.order_by(desc(EMonitor.timestamp)).limit(20).all()

return render_template("index.html", table)The full source code(Both EMonitor device & Server) can also be viewed in [https://github.com/anjuchamantha/EMonitor
Below is the directory & file structure of the device & server source codes

#include <Arduino.h>
#include <WiFi.h>
#include <queue>
using namespace std;
#include "xml.h"
#include "http.h"
#include "time.h"

#include "readings.h"
#include "wifi_con.h"
#include "config.h"
#include "utils.h"

#include <Adafruit_GFX.h>
#include <Adafruit_SSD1306.h>

#include "mail_client.h"

#define SCREEN_WIDTH 128 // OLED display width, in pixels
#define SCREEN_HEIGHT 64 // OLED display height, in pixels

// Declaration for an SSD1306 display connected to I2C (SDA, SCL pins)
Adafruit_SSD1306 display(SCREEN_WIDTH, SCREEN_HEIGHT, &Wire, -1);

void beginOLED()
{
  if (!display.begin(SSD1306_SWITCHCAPVCC, 0x3C))
  { // Address 0x3D for 128x64
    Serial.println(F("SSD1306 allocation failed"));
    for (;;)
      ;
  }
  delay(2000);
  display.clearDisplay();
  display.setTextSize(2);
  display.setTextColor(WHITE);
  display.setCursor(20, 25);
  display.println("EMonitor");
  display.setTextSize(1);
  display.println("");
  display.println("GITHUB/ANJUCHAMANTHA");
  display.display();
  delay(5000);
  display.setCursor(0, 0);
}

String t0 = "";
String t1 = "";
String t2 = "";
String t3 = "";
String t4 = "";
String t5 = "";
String t6 = "";
String t7 = "";

void displayText()
{
  display.setCursor(0, 0);
  display.clearDisplay();
  display.println(t0);
  display.println(t1);
  display.println(t2);
  display.println(t3);
  display.println(t4);
  display.println(t5);
  display.println(t6);
  display.println(t7);
  display.display();
}

const char *ntpServer = "pool.ntp.org";
const long gmtOffset_sec = 19800;
const int daylightOffset_sec = 0;

queue<String> buffer_identifier;
queue<String> buffer_datetime;
queue<int> buffer_msg_ids;

//mean buffers
queue<double> buffer_t;
queue<double> buffer_h;
queue<double> buffer_p;
queue<double> buffer_l;

//sd buffers
queue<double> buffer_t_;
queue<double> buffer_h_;
queue<double> buffer_p_;
queue<double> buffer_l_;

int msg = 0;
double temperature = 0;
double humidity = 0;
double pressure = 0;
double light = 0;
double temperature_sd = 0;
double humidity_sd = 0;
double pressure_sd = 0;
double light_sd = 0;

char xmlchar[1700];
String identifier;
char datetime_[32] = {};
String datetime;

void getTimeStamp(char *datetime_)
{
  struct tm timeinfo;
  if (!getLocalTime(&timeinfo))
  {
    Serial.println("Failed to obtain time");
  }
  Serial.print("[TIME] ");
  // sprintf(times, &timeinfo, "%Y-%m-%dT%H:%M:%S%z");
  // Serial.println(&timeinfo, "%Y-%m-%dT%H:%M:%S%z");

  char timeString[32];
  time_t timeT = time(NULL);
  strftime(timeString, sizeof(timeString), "%Y-%m-%dT%H:%M:%S%z", localtime(&timeT));
  printf("%s\n", timeString);
  sprintf(datetime_, timeString);
  // datetime_ = timeString;
}

void popBuffers()
{
  buffer_msg_ids.pop();
  buffer_identifier.pop();
  buffer_datetime.pop();

  buffer_t.pop();
  buffer_h.pop();
  buffer_p.pop();
  buffer_l.pop();

  buffer_t_.pop();
  buffer_h_.pop();
  buffer_p_.pop();
  buffer_l_.pop();
}

void pushToBuffers()
{
  buffer_msg_ids.push(msg);
  buffer_identifier.push(identifier);
  buffer_datetime.push(datetime);

  buffer_t.push(temperature);
  buffer_h.push(humidity);
  buffer_p.push(pressure);
  buffer_l.push(light);

  buffer_t_.push(temperature_sd);
  buffer_h_.push(humidity_sd);
  buffer_p_.push(pressure_sd);
  buffer_l_.push(light_sd);
}

void setup()
{
  Serial.begin(115200);
  beginOLED();
  t7 = String("WIFI   : 0");
  t6 = String("SERVER : 0");
  displayText();
  wait_and_connect_to_wifi();
  t7 = String("WIFI   : 1");
  displayText();
  begin_sensors();
  configTime(gmtOffset_sec, daylightOffset_sec, ntpServer);
}

bool mailSent = false;
int mailTime = 10;

void loop()
{
  //BUFFER LOGIC

  //if buffer is not empty
  //    loop buffer
  //      if connected
  //        POST buffer data
  //      else break
  while (!buffer_msg_ids.empty())
  {
    Serial.println("[BUFFER] Processing Buffer... ");
    if (WiFi.status() == WL_CONNECTED)
    {
      t7 = String("WIFI   : 1");
      displayText();
      char xmlchar_buf[1700];

      int msg_id_buf = buffer_msg_ids.front();
      String identifier_buf = (String)buffer_identifier.front();
      String datetime_buf = (String)buffer_datetime.front();

      double t_buf = buffer_t.front();
      double h_buf = buffer_h.front();
      double p_buf = buffer_p.front();
      double l_buf = buffer_l.front();

      double t_sd_buf = buffer_t_.front();
      double h_sd_buf = buffer_h_.front();
      double p_sd_buf = buffer_p_.front();
      double l_sd_buf = buffer_l_.front();

      generateXMLStr(xmlchar_buf,
                     t_buf, h_buf, p_buf, l_buf,
                     t_sd_buf, h_sd_buf, p_sd_buf, l_sd_buf,
                     identifier_buf, datetime_buf);
      if (sendPostRequest(xmlchar_buf, msg_id_buf))
      {

        Serial.printf("[BUFFER] POST successful for : MSG %i\n\n", msg_id_buf);
        popBuffers();
        t6 = String("SERVER : 1 M-" + String(msg_id_buf) + " <B>");
        displayText();
      }
      else
      {
        t6 = String("SERVER : 0");
        displayText();
        Serial.printf("[BUFFER] POST Failed for : MSG %i\n\n", msg_id_buf);
        break;
      }
    }
    else
    {
      Serial.println("[WIFi] Not Connected !");
      t7 = String("WIFI   : 0");
      t6 = String("SERVER : 0");
      displayText();
      Serial.println("[BUFFER] Buffer Processing Skipped !\n\n");
      break;
    }
  }

  // MAIN LOGIC

  int x = 0;
  //Get 10 sensor values in 0.5s intervals
  //Calculate median & s.d for values in 10s intervals (10 readings x 1s)
  int rounds = 15;
  int round_time = 2000;

  //get values and keep in the arrays
  double t_[rounds];
  double h_[rounds];
  double p_[rounds];
  double l_[rounds];

  Serial.print("[SENSORS] Reading sensors > ");
  String temp = String("M-" + String(msg) + " ");
  while (x < rounds)
  {
    t_[x] = round(readTemperature() * 100) / 100.00;
    h_[x] = round(readHumidity() * 100) / 100.00;
    p_[x] = round(readPressure() * 100) / 100.00;
    l_[x] = round(readLightIntensity() * 100) / 100.00;
    Serial.print(".");
    temp = temp + "-";
    t5 = temp;
    displayText();
    delay(round_time);
    x++;
  }
  Serial.print("\n");

  temperature = calculate_mean(t_, rounds);
  humidity = calculate_mean(h_, rounds);
  pressure = calculate_mean(p_, rounds);
  light = calculate_mean(l_, rounds);

  temperature_sd = calculate_sd(t_, rounds, temperature);
  humidity_sd = calculate_sd(h_, rounds, humidity);
  pressure_sd = calculate_sd(p_, rounds, pressure);
  light_sd = calculate_sd(l_, rounds, light);

  Serial.printf("Temperature : %.2f +- %.2f %s \n", temperature, temperature_sd, "°C");
  Serial.printf("Humidity    : %.2f +- %.2f %s \n", humidity, humidity_sd, "%");
  Serial.printf("Pressure    : %.2f +- %.2f %s \n", pressure, pressure_sd, "Pa");
  Serial.printf("Light       : %.2f +- %.2f %s \n", light, light_sd, "%");
  Serial.print("\n");

  t0 = String("Temp     " + String(temperature) + "     C");
  t1 = String("Humidity " + String(humidity) + "     %");
  t2 = String("Pressure " + String(pressure) + " Pa");
  t3 = String("Light    " + String(light) + "     %");
  displayText();

  identifier = String(msg);
  getTimeStamp(datetime_);
  datetime = String(datetime_);

  if ((temperature > 40) && (WiFi.status() == WL_CONNECTED))
  {
    if (!mailSent || (mailTime < 1))
    {
      sendMail(temperature);
      mailSent = true;
      mailTime = 10;
    }
    mailTime--;
  }

  // Get the xml as a string to xmlchar variable
  generateXMLStr(xmlchar,
                 temperature, humidity, pressure, light,
                 temperature_sd, humidity_sd, pressure_sd, light_sd,
                 identifier, datetime);
  if (WiFi.status() != WL_CONNECTED)
  {
    t7 = String("WIFI   : 0");
    t6 = String("SERVER : 0");
    displayText();
    bool connected = connect_to_wifi();
    if (connected)
    {
      t7 = String("WIFI   : 1");
      displayText();
      if (!sendPostRequest(xmlchar, msg))
      {
        pushToBuffers();
        Serial.printf("[BUFFER] MSG %i Queued !\n\n", msg);
        t6 = String("SERVER : 0 M-" + String(msg) + " *");
        displayText();
      }
      t6 = String("SERVER : 1 M-" + String(msg));
      displayText();
    }
    else
    {
      pushToBuffers();
      Serial.printf("[BUFFER] MSG %i Queued !\n\n", msg);
      t7 = String("WIFI   : 0");
      t6 = String("SERVER : 0 M-" + String(msg) + " *");
      displayText();
    }
  }
  else
  {
    t7 = String("WIFI   : 1");
    displayText();
    if (!sendPostRequest(xmlchar, msg))
    {
      pushToBuffers();
      Serial.printf("[BUFFER] MSG %i Queued !\n\n", msg);
      t6 = String("SERVER : 0 M-" + String(msg) + " *");
      displayText();
    }
    else
    {
      t6 = String("SERVER : 1 M-" + String(msg));
      displayText();
    }
  }
  msg++;
}const char *SSID = "WIFI SSID";
const char *PW = "WIFI PASSWORD";
const char *serverBase = "http://e-monitor.herokuapp.com/";#ifndef SENSITIVE_CONFIG_H
#define SENSITIVE_CONFIG_H
extern const char *SSID;
extern const char *PW;
extern const char *serverBase;
#define emailSenderAccount "SENDER EMAIL ADDRESS"
#define emailSenderPassword "SENDER EMAIL ADDRESS PASSWORD"
#define emailRecipient "RECEIVER EMAIL ADDRESS"
#define smtpServer "smtp.gmail.com"
#define smtpServerPort 465
#define emailSubject "EMonitor Device Alert!"
#endif#include <Arduino.h>
#include <WiFi.h>
#include <HTTPClient.h>
#include "config.h"
bool sendPostRequest(char *xmlstr, int msg)
{
if (WiFi.status() != WL_CONNECTED)
{
Serial.println("[WIFI] Connection lost !");
Serial.println();
return false;
}
// Send POST request
HTTPClient http;
String url = (String)serverBase + "/data";
http.begin((String)url);
Serial.printf("[HTTP] POST Request : MSG %i\n", msg);
int responseCode = http.POST(xmlstr);
http.end();
// Connection failed error codes
if (responseCode < 0)
{
String errorMessage = http.errorToString(responseCode).c_str();
Serial.printf("[HTTP] Request failed: %s\n", errorMessage.c_str());
return false;
}
// Server returned error code
if (responseCode != HTTP_CODE_OK)
{
Serial.printf("[HTTP] %d \n", responseCode);
return false;
}
// Success
Serial.printf("[HTTP] %d : %s\n\n", responseCode, "OK");
return true;
}#ifndef HTTP_H
#define HTTP_H
bool sendPostRequest(char *xmlstr, int msg);
#endif#include "ESP32_MailClient.h"
#include "config.h"
SMTPData smtpData;
// Callback function to get the Email sending status
void sendCallback(SendStatus info);
void sendMail(double temperature)
{
Serial.println("\n----------------");
Serial.println("[MAIL] Preparing to send email...");
Serial.println();
smtpData.setLogin(smtpServer, smtpServerPort, emailSenderAccount, emailSenderPassword);
smtpData.setSender("EMonitor Device", emailSenderAccount);
smtpData.setPriority("High");
smtpData.setSubject(emailSubject);
smtpData.setMessage("<div><h1 style=\"color:#ff9966;\"> EMonitor Device Alert !</h1><p>Temperature threshold exceeded !</p><h2 style=\"color:#cc3300;\"> Temperature = " + String(temperature) + " °C</h2><p><a href=\"" + String(serverBase) + "\">Visit EMonitor website</a></p></div>",
true);
smtpData.addRecipient(emailRecipient);
//smtpData.addRecipient("YOUR_OTHER_RECIPIENT_EMAIL_ADDRESS@EXAMPLE.com");
smtpData.setSendCallback(sendCallback);
if (!MailClient.sendMail(smtpData))
Serial.println("[MAIL] Error sending Email, " + MailClient.smtpErrorReason());
smtpData.empty();
}
// Callback function to get the Email sending status
void sendCallback(SendStatus msg)
{
Serial.println("[MAIL]" + msg.info());
if (msg.success())
{
Serial.println("----------------");
}
}#ifndef ALERT_MAIL_H
#define ALERT_MAIL_H
void sendMail(double temperature);
#endif#include <Arduino.h>
#include "DHT.h"
#include <Wire.h>
#include <Adafruit_BMP085.h>
#define DHTPIN 4
#define DHTTYPE DHT11
DHT dht(DHTPIN, DHTTYPE);
Adafruit_BMP085 bmp;
// Potentiometer is connected to GPIO 34 (Analog ADC1_CH6)
const int ldrPin = A0;
void begin_sensors()
{
dht.begin();
if (!bmp.begin())
{
Serial.println("Could not find a valid BMP085 sensor, check wiring!");
while (1)
{
}
}
}
float readTemperature()
{
float t = dht.readTemperature();
// Check if any reads failed and exit early (to try again).
if (isnan(t))
{
Serial.println(F("[DHT] Failed to read Temperature from DHT sensor!\n"));
return 0;
}
return t;
}
float readHumidity()
{
float h = dht.readHumidity();
if (isnan(h))
{
Serial.println(F("[DHT] Failed to read Humidity from DHT sensor!\n"));
return 0;
}
return h;
}
float readPressure()
{
float p = bmp.readPressure();
if (isnan(p))
{
Serial.println(F("[BMP] Failed to read Pressure from BMP sensor!\n"));
return 0;
}
return p;
}
float readLightIntensity()
{
float ldrVal = analogRead(ldrPin) * 100 / 3000;
if (ldrVal > 100)
{
return 100.00;
}
return ldrVal;
}#ifndef READINGS_H
#define READINGS_H
void begin_sensors();
float readTemperature();
float readHumidity();
float readPressure();
float readLightIntensity();
#endif#include <Arduino.h>
double calculate_mean(double arr[], int len)
{
double tot = 0;
for (int i = 0; i < len; i++)
{
tot += arr[i];
}
return round((tot / len) * 100) / 100.00;
}
double calculate_sd(double arr[], int len, double mean)
{
double variance = 0;
for (int i = 0; i < len; i++)
{
variance += pow((arr[i] - mean), 2);
}
return round(sqrt(variance) * 100) / 100.00;
}#ifndef UTILS_H
#define UTILS_H
double calculate_mean(double arr[], int len);
double calculate_sd(double arr[], int len, double mean);
#endif#include <Arduino.h>
#include <WiFi.h>
#include "config.h"
void wait_and_connect_to_wifi()
{
WiFi.begin(SSID, PW);
Serial.println("");
while (WiFi.status() != WL_CONNECTED)
{
delay(1000);
Serial.print("[WIFI] Trying to connect to : ");
Serial.print(SSID);
Serial.println("...");
}
Serial.print("[WIFI] Connected to : ");
Serial.println(SSID);
Serial.println("");
}
bool connect_to_wifi()
{
WiFi.begin(SSID, PW);
if (WiFi.status() == WL_CONNECTED)
{
Serial.print("[WIFI] Re-connected to : ");
Serial.println(SSID);
Serial.println();
return true;
}
Serial.println("[WIFI] Not Connected to Wifi");
return false;
}#ifndef WIFI_CON_H
#define WIFI_CON_H
void wait_and_connect_to_wifi();
bool connect_to_wifi();
#endif#include <Arduino.h>
void generateXMLStr(char *xmlchar,
double temperature, double humidity, double pressure, double light,
double temperature_sd, double humidity_sd, double pressure_sd, double light_sd,
String identifier, String timestamp)
{
String temp = String(temperature);
String hum = String(humidity);
String pres = String(pressure);
String lig = String(light);
String temp_sd = String(temperature_sd);
String hum_sd = String(humidity_sd);
String pres_sd = String(pressure_sd);
String lig_sd = String(light_sd);
sprintf(
xmlchar,
"<?xml version = \"1.0\" encoding = \"utf8\"?>"
"<alert>"
"<identifier>%s</identifier>"
"<sender> EMONITOR1</sender>"
"<sent> %s</sent>"
"<status> Actual</status>"
"<msgType> Alert</msgType>"
"<scope> Public</scope>"
"<info>"
"<category> Env</category>"
"<event> Readings</event>"
"<urgency> Past</urgency>"
"<severity> Minor</severity>"
"<certainty> Observed</certainty>"
"<senderName> EMONITOR1 Device</senderName>"
"<parameter><valueName>%s</valueName><value>%s</value></parameter>"
"<parameter><valueName>%s</valueName><value>%s</value></parameter>"
"<parameter><valueName>%s</valueName><value>%s</value></parameter>"
"<parameter><valueName>%s</valueName><value>%s</value></parameter>"
"<parameter><valueName>%s</valueName><value>%s</value></parameter>"
"<parameter><valueName>%s</valueName><value>%s</value></parameter>"
"<parameter><valueName>%s</valueName><value>%s</value></parameter>"
"<parameter><valueName>%s</valueName><value>%s</value></parameter>"
"<area><areaDesc>Wadduwa,Sri Lanka</areaDesc></area>"
"</info>"
"</alert>",
identifier.c_str(), timestamp.c_str(),
"temperature", temp.c_str(),
"humidity", hum.c_str(),
"pressure", pres.c_str(),
"lightIntensity", lig.c_str(),
"temperature_sd", temp_sd.c_str(),
"humidity_sd", hum_sd.c_str(),
"pressure_sd", pres_sd.c_str(),
"lightIntensity_sd", lig_sd.c_str()
);
}#ifndef XML_H
#define XML_H
void generateXMLStr(char *xmlchar,
double temperature, double humidity, double pressure, double light,
double temperature_sd, double humidity_sd, double pressure_sd, double light_sd,String identifier, String timestamp);
#endif
from flask import Flask, request, render_template
from flask_sqlalchemy import SQLAlchemy
from sqlalchemy import desc, asc
from flask_restful import Api, Resource
from xml.etree import ElementTree

import sys
import logging

app = Flask(__name__)

ENV = 'production'

if ENV == 'dev':
    app.debug = True
    app.config['SQLALCHEMY_DATABASE_URI'] = 'postgresql://postgres:password@localhost/EMonitorDB'

else:
    debug = False
    app.config[
        'SQLALCHEMY_DATABASE_URI'] = 'postgres://hzbuwdagklnpog:3d389e4927a6df93af4704c4cef861a000b85b6dac31c7f31832b56eb7daf297@ec2-54-156-53-71.compute-1.amazonaws.com:5432/dfuqu09213kv5f'

    app.logger.addHandler(logging.StreamHandler(sys.stdout))
    app.logger.setLevel(logging.ERROR)

app.config['SQLALCHEMY_TRACK_MODIFICATIONS'] = False

db = SQLAlchemy(app)


class EMonitor(db.Model):
    __tablename__ = 'sensor_data'
    id = db.Column(db.Integer, primary_key=True)
    msg_id = db.Column(db.String(128))
    timestamp = db.Column(db.String(128))

    temperature = db.Column(db.Float)
    humidity = db.Column(db.Float)
    pressure = db.Column(db.Float)
    light = db.Column(db.Float)

    temperature_sd = db.Column(db.Float)
    humidity_sd = db.Column(db.Float)
    pressure_sd = db.Column(db.Float)
    light_sd = db.Column(db.Float)

    def __init__(self, msg_id, timestamp, temperature, humidity,
                 pressure, light, temperature_sd, humidity_sd, pressure_sd, light_sd):
        self.msg_id = msg_id
        self.timestamp = timestamp

        self.temperature = temperature
        self.humidity = humidity
        self.pressure = pressure
        self.light = light

        self.temperature_sd = temperature_sd
        self.humidity_sd = humidity_sd
        self.pressure_sd = pressure_sd
        self.light_sd = light_sd


def extract_data_from_xml(xml_str):
    """
    Given a XML string(CAP) this extracts the 'parameter' values
    :param xml_str: XML as a string
    :return: data as dictionary {name:value}
    """
    root = ElementTree.fromstring(xml_str)
    param = root.findall('info/parameter')
    datetime = root.find('sent').text.strip()
    identifier = root.find('identifier').text.strip()
    readings = dict()
    readings['datetime'] = datetime
    readings['identifier'] = identifier
    data = {}
    for p in param:
        name = p.find('valueName').text.strip()
        value = p.find('value').text.strip()
        data[name] = float(value)
    readings["data"] = data
    return readings


def put_to_db(xml_data):
    """
    given a data dictionary this method put the data to the database
    :param xml_data: data as dictionary {name:value}
    :return: True if database write successful, otherwise False
    """
    msg_id = (xml_data['identifier'])
    timestamp = xml_data['datetime']

    temperature = xml_data['data']['temperature']
    humidity = xml_data['data']['humidity']
    pressure = xml_data['data']['pressure']
    light = xml_data['data']['lightIntensity']

    temperature_sd = xml_data['data']['temperature_sd']
    humidity_sd = xml_data['data']['humidity_sd']
    pressure_sd = xml_data['data']['pressure_sd']
    light_sd = xml_data['data']['lightIntensity_sd']

    try:
        DB_data = EMonitor(msg_id, timestamp, temperature, humidity, pressure, light,
                           temperature_sd, humidity_sd, pressure_sd, light_sd)
        db.session.add(DB_data)
        db.session.commit()
        return True

    except:
        return False


@app.route('/data', methods=['POST'])
def post():
    xml_str = request.data
    xml_data = extract_data_from_xml(xml_str)
    print("[POST] /data : ", xml_data)
    if put_to_db(xml_data):
        return "DATABASE updated"
    else:
        return "DATABASE modification failed !"


@app.route('/')
def index():
    table = EMonitor.query.order_by(desc(EMonitor.timestamp)).limit(20).all()

    datetimes = []
    ids = []
    t = []
    h = []
    p = []
    l = []

    t_sd = []
    h_sd = []
    p_sd = []
    l_sd = []
    for row in reversed(table):
        datetimes.append(row.timestamp.split('T')[1].split('+')[0])
        ids.append(row.msg_id)

        t.append(row.temperature)
        h.append(row.humidity)
        p.append(row.pressure)
        l.append(row.light)

        t_sd.append(row.temperature_sd)
        h_sd.append(row.humidity_sd)
        p_sd.append(row.pressure_sd)
        l_sd.append(row.light_sd)

    return render_template("index.html", table=table, datetimes=datetimes, ids=ids, t=t, h=h, p=p, l=l, t_sd=t_sd,
                           h_sd=h_sd, p_sd=p_sd, l_sd=l_sd)


if __name__ == "__main__":
app.run(port=2017)<!DOCTYPE html>
<html>
<head>
<meta charset="UTF-8">
<meta name="viewport" content="width=device-width,initial-scale=1">
<title>EMonitor</title>
<script
src="https://cdn.jsdelivr.net/npm/chart.js@2.9.4/dist/Chart.min.js"></script>
<link rel="stylesheet" href="https://www.w3schools.com/w3css/4/w3.css">
<link rel="stylesheet"
href="https://stackpath.bootstrapcdn.com/bootstrap/4.5.2/css/bootstrap.min.css">
<link rel="stylesheet" href="../static/style.css">
</head>
<body>
<div class="card">
</div>
<div class="widget-container">
<!-- Weather Widget -->
<div class="widget">
<div class="left">
<img src="../static/images/cloud.svg" class="icon">
<h5 class="weather-status">MSG {{ table[0].msg_id }}</h5>
</div>
<div class="right">
<h5 class="city">On {{ table[0].timestamp.split('T')[0] }}
</h5>
<h5 class="city">@ {{
table[0].timestamp.split('T')[1].split('+')[0] }}</h5>
<h5 class="degree">{{ table[0].temperature }}°c</h5>
</div>
<div class="bottom">
<div>
Humidity (%)<h3> {{ table[0].humidity }}</h3>
</div>
<div>
Pressure (Pa)<h3>{{ table[0].pressure }}</h3>
</div>
<div>
Light (%)<h3>{{ table[0].light }}</h3>
</div>
</div>
</div>
<!-- ./End of weather widget -->
</div>
<div class="chart-container">
<canvas id="temperatureChart"></canvas>
</div>
<div class="chart-container">
<canvas id="humidityChart"></canvas>
</div>
<div class="chart-container">
<canvas id="pressureChart"></canvas>
</div>
<div class="chart-container">
<canvas id="lightChart"></canvas>
</div>
<div class="table-div">
<table>
<tr>
<th>#</th>
<th>Identifier</th>
<th>Timestamp</th>
<th>Temp (°C)</th>
<th>SD</th>
<th>Humidity (%)</th>
<th>SD</th>
<th>Pressure (Pa)</th>
<th>SD</th>
<th>Light (%)</th>
<th>SD</th>
</tr>
{% for entry in table %}
<tr>
<td>{{ entry.id }}</td>
<td>{{ entry.msg_id }}</td>
<td>{{ entry.timestamp.split('T')[0] }} {{
entry.timestamp.split('T')[1].split('+')[0] }}</td>
<td>{{ entry.temperature }}</td>
<td>{{ entry.temperature_sd }}</td>
<td>{{ entry.humidity }}</td>
<td>{{ entry.humidity_sd }}</td>
<td>{{ entry.pressure }}</td>
<td>{{ entry.pressure_sd }}</td>
<td>{{ entry.light }}</td>
<td>{{ entry.light_sd }}</td>
</tr>
{% endfor %}
</table>
</div>
<script>
// Global parameters:
// do not resize the chart canvas when its container does (keep at 600x400px)
// Chart.defaults.global.responsive = false;
// define the chart data
var temperatureData = {
labels : [{% for item in datetimes %}
"{{item}}",
{% endfor %}],
datasets : [{
label: ' Temperature (°C)',
fill: true,
lineTension: 0.1,
backgroundColor: "rgba(253,128,128,0.4)",
borderColor: "rgba(253,128,128,1)",
borderCapStyle: 'butt',
borderDash: [],
borderDashOffset: 0.0,
borderJoinStyle: 'miter',
pointBorderColor: "rgba(253,128,128,1)",
pointBackgroundColor: "#fff",
pointBorderWidth: 1,
pointHoverRadius: 5,
pointHoverBackgroundColor: "rgba(253,128,128,1)",
pointHoverBorderColor: "rgba(253,128,128,1)",
pointHoverBorderWidth: 2,
pointRadius: 1,
pointHitRadius: 10,
data : [{% for item in t %}
{{item}},
{% endfor %}],
spanGaps: false
}]
}
var humidityData = {
labels : [{% for item in datetimes %}
"{{item}}",
{% endfor %}],
datasets : [{
label: ' Humidity (%)',
fill: true,
lineTension: 0.1,
backgroundColor: "rgba(148,218,251,0.4)",
borderColor: "rgba(148,218,251,1)",
borderCapStyle: 'butt',
borderDash: [],
borderDashOffset: 0.0,
borderJoinStyle: 'miter',
pointBorderColor: "rgba(148,218,251,1)",
pointBackgroundColor: "#fff",
pointBorderWidth: 1,
pointHoverRadius: 5,
pointHoverBackgroundColor: "rgba(148,218,251,1)",
pointHoverBorderColor: "rgba(148,218,251,1)",
pointHoverBorderWidth: 2,
pointRadius: 1,
pointHitRadius: 10,
data : [{% for item in h %}
{{item}},
{% endfor %}],
spanGaps: false
}]
}
var pressureData = {
labels : [{% for item in datetimes %}
"{{item}}",
{% endfor %}],
datasets : [{
label: ' Pressure (Pa)',
fill: true,
lineTension: 0.1,
backgroundColor: "rgba(252,186,57,0.4)",
borderColor: "rgba(252,186,57,1)",
borderCapStyle: 'butt',
borderDash: [],
borderDashOffset: 0.0,
borderJoinStyle: 'miter',
pointBorderColor: "rgba(252,186,57,1)",
pointBackgroundColor: "#fff",
pointBorderWidth: 1,
pointHoverRadius: 5,
pointHoverBackgroundColor: "rgba(252,186,57,1)",
pointHoverBorderColor: "rgba(252,186,57,1)",
pointHoverBorderWidth: 2,
pointRadius: 1,
pointHitRadius: 10,
data : [{% for item in p %}
{{item}},
{% endfor %}],
spanGaps: false
}]
}
var lightData = {
labels : [{% for item in datetimes %}
"{{item}}",
{% endfor %}],
datasets : [{
label: ' Light (%)',
fill: true,
lineTension: 0.1,
backgroundColor: "rgba(38,231,166,0.4)",
borderColor: "rgba(38,231,166,1)",
borderCapStyle: 'butt',
borderDash: [],
borderDashOffset: 0.0,
borderJoinStyle: 'miter',
pointBorderColor: "rgba(38,231,166,1)",
pointBackgroundColor: "#fff",
pointBorderWidth: 1,
pointHoverRadius: 5,
pointHoverBackgroundColor: "rgba(38,231,166,1)",
pointHoverBorderColor: "rgba(38,231,166,1)",
pointHoverBorderWidth: 2,
pointRadius: 1,
pointHitRadius: 10,
data : [{% for item in l %}
{{item}},
{% endfor %}],
spanGaps: false
}]
}
// get chart canvas
var ctx1 = document.getElementById("temperatureChart").getContext("2d");
// create the chart using the chart canvas
var temperatureChart = new Chart(ctx1, {
type: 'line',
data: temperatureData,
options: {
maintainAspectRatio:false,
scales: {
xAxes: [{
gridLines: {
display: true
}
}],
yAxes: [{
gridLines: {
display: false
}
}]
}
}
});
var ctx2 = document.getElementById("humidityChart").getContext("2d");
// create the chart using the chart canvas
var humidityChart = new Chart(ctx2, {
type: 'line',
data: humidityData,
options: {
maintainAspectRatio:false,
scales: {
xAxes: [{
gridLines: {
display: true
}
}],
yAxes: [{
gridLines: {
display: false
}
}]
}
}
});
var ctx3 = document.getElementById("pressureChart").getContext("2d");
// create the chart using the chart canvas
var pressureChart = new Chart(ctx3, {
type: 'line',
data: pressureData,
options: {
maintainAspectRatio:false,
scales: {
xAxes: [{
gridLines: {
display: true
}
}],
yAxes: [{
gridLines: {
display: false
}
}]
}
}
});
var ctx4 = document.getElementById("lightChart").getContext("2d");
// create the chart using the chart canvas
var lightChart = new Chart(ctx4, {
type: 'line',
data: lightData,
options: {
maintainAspectRatio:false,
scales: {
xAxes: [{
gridLines: {
display: true
}
}],
yAxes: [{
gridLines: {
display: false
}
}]
}
}
});
</script>
</body>
</html>@import url("https://fonts.googleapis.com/css2?family=Poppins:wght@100;200;600&display=swap");
body,
html {
height: 100%;
margin: 0;
font-family: "Poppins", sans-serif;
}
.widget-container {
top: 150px;
left: 50%;
position: absolute;
transform: translate(-50%, -50%);
}
.chart-container {
margin: 20px;
margin-bottom: 50px;
}
.widget {
width: 360px;
height: 250px;
border-radius: 20px;
/* background: rgba(299, 299, 299, 0.4); */
background-color: black;
}
.widget .left {
position: absolute;
left: 0;
width: 200px;
}
.widget .right {
position: absolute;
right: 0;
width: 200px;
color: #fff;
margin: 50px 0;
}
.icon {
width: 75%;
margin-bottom: -30px;
display: block;
margin-left: auto;
margin-right: auto;
}
.weather-status {
color: #fff;
text-align: center;
margin-top: 0;
}
.widget .right .city {
font-size: 1em;
text-align: center;
margin: 0;
text-shadow: 1px 1px 5px #707070;
}
.widget .right .degree {
font-size: 3em;
font-weight: bold;
text-align: center;
margin: 0;
text-shadow: 1px 1px 5px #707070;
}
.widget .bottom {
width: 100%;
position: absolute;
bottom: 10px;
display: flex;
justify-content: center;
color: #fff;
}
.widget .bottom div {
/* background-color: yellow; */
margin: 5px 15px 5px 15px;
text-align: center;
line-height: 100%;
font-size: 0.83em;
text-shadow: 1px 1px 5px #707070;
}
.bottom div h3 {
display: block;
/* font-weight: bold; */
}
.table-div {
margin-top: 20px;
overflow-x: auto;
}
table {
border-collapse: collapse;
width: 100%;
}
th,
td {
padding: 8px;
text-align: left;
border-bottom: 1px solid #ddd;
}
tr:hover {
background-color: #f5f5f5;
}
.card {
/* all: initial; */
padding: 20px;
margin: auto;
width: 100%;
height: 300px;
align-content: center;
/* background-color: #698996; */
}