Using Python, SQLAlchemy, and Flask, analyze and visualize climate data as you prepare to open up a surf shop.
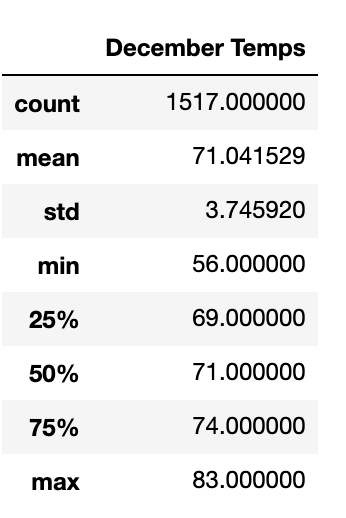
An analysis on Oahu's weather could help determine whether seasons affect the surf and ice cream shop business in the island. In this analysis, I compared June and December data to describe summer and winter temperatures across a seven-year period. During this time period, both June and December had an average temperature of 75°F and and 71°F, respectively. June had a low temperature of 64°F and a high temperature of 85°F whereas December had a low temperature of 56°F and a high temperature of 83°F. In addition, both June and December had roughly similar standard deviations. June's standard deviation of 3.26 and December's standard deviation of 3.75 tells me that their temperature records are concentrated around both of their average temperatures. Lastly, June and December had a 75th percentile of 77°F and 74°F, respectively, which indicates that these two seasons had relatively warm temperatures.
In addition to temperature, I would recommend further analysis on:
Precipitation to observe quantity and frequency during June and December, and determine whether precipitation plays a factor despite the warm temperatures that are experienced during this time.
Elevation to observe and compare in various locations in Oahu, and determine whether one location's elevation attracts or deters business more than another location.
Elevation relative to both temperature and precipitation during June and December, and determine whether these metrics coupled together also contribute to business.